
AMSD in the News
Special Education Enrollment, Costs Continue to Rise—and Shift
Senate on E-12 Policy Committee held hearing July 24 on special education enrollment and spending trends
Special education enrollment has steadily increased across Minnesota since 2003 — from nearly 116,000 students to more than 142,000 in FY2018 — and now accounts for more than 16 percent of the state’s student population.
In that same timeframe, the average special education expenditure per student has increased from $9,200 in 2003 to more than $14,000 in 2017.
Those figures were among the highlights from a July 24 Committee on E-12 Policy hearing on special education enrollment and spending trends, with presentations from Jody Hauer of the Office of the Legislative Auditor, and Dr. Tom Melcher, director of the Program Finance Division at the Minnesota Department of Education.
The cost increases, and the growth in numbers, are no surprise to members of AMSD, of course. It’s why special education funding has been among AMSD’s most significant legislative priorities for several years.
But for AMSD members, that growth isn’t the only statewide trend worth noting.
The enrollment is also shifting.
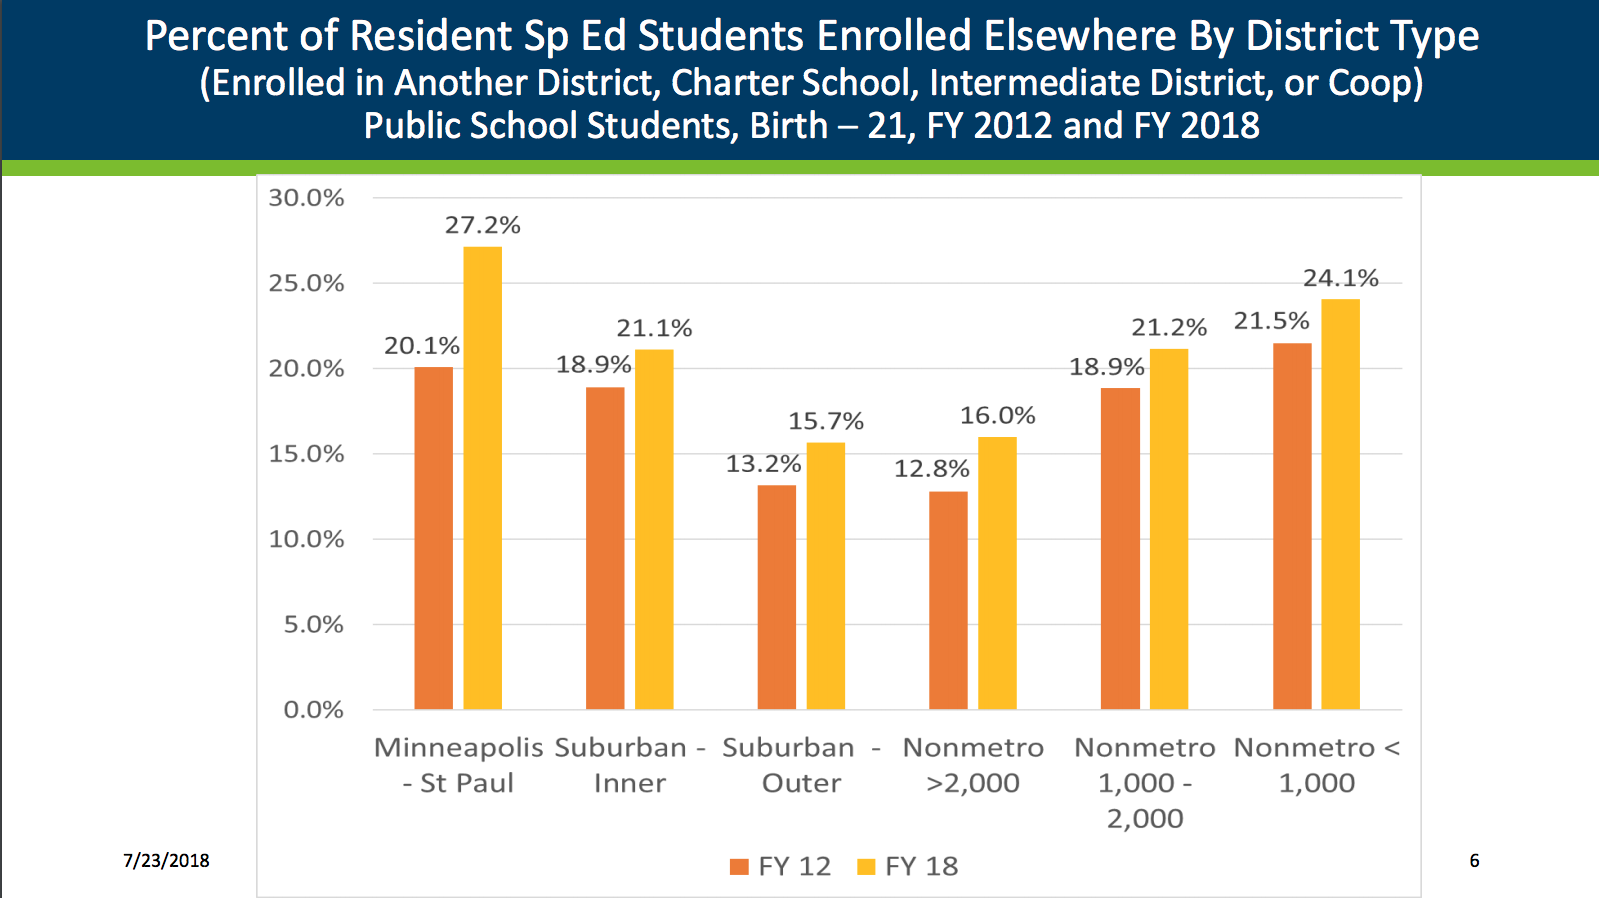
That is, the number of special education students enrolling outside of their home districts is also showing an upward trend, with parents across Minnesota more frequently taking their children out of their home districts for special education.
Statewide, an estimated 20 percent of special education students are served outside their home districts with 57 percent of those students enrolling in neighboring districts, 27 percent enrolling in a charter school and 16 percent being served in an intermediate or cooperative district. In the metro, the percentage of total enrollment now outside their home district for special education in Minneapolis and Saint Paul is at 6 percent — an upward trend that is seen in all district types. Suburban and non-metro districts have seen enrollments out of their home districts grow between 2 to 4 percent.
While data doesn’t provide the reasons why parents are leaving their home districts, much of this trend can likely be traced to the provision of services. Improvements in special needs diagnoses, for example, often allow parents to target the best resources for their children — basically allowing them shop around for the best services.
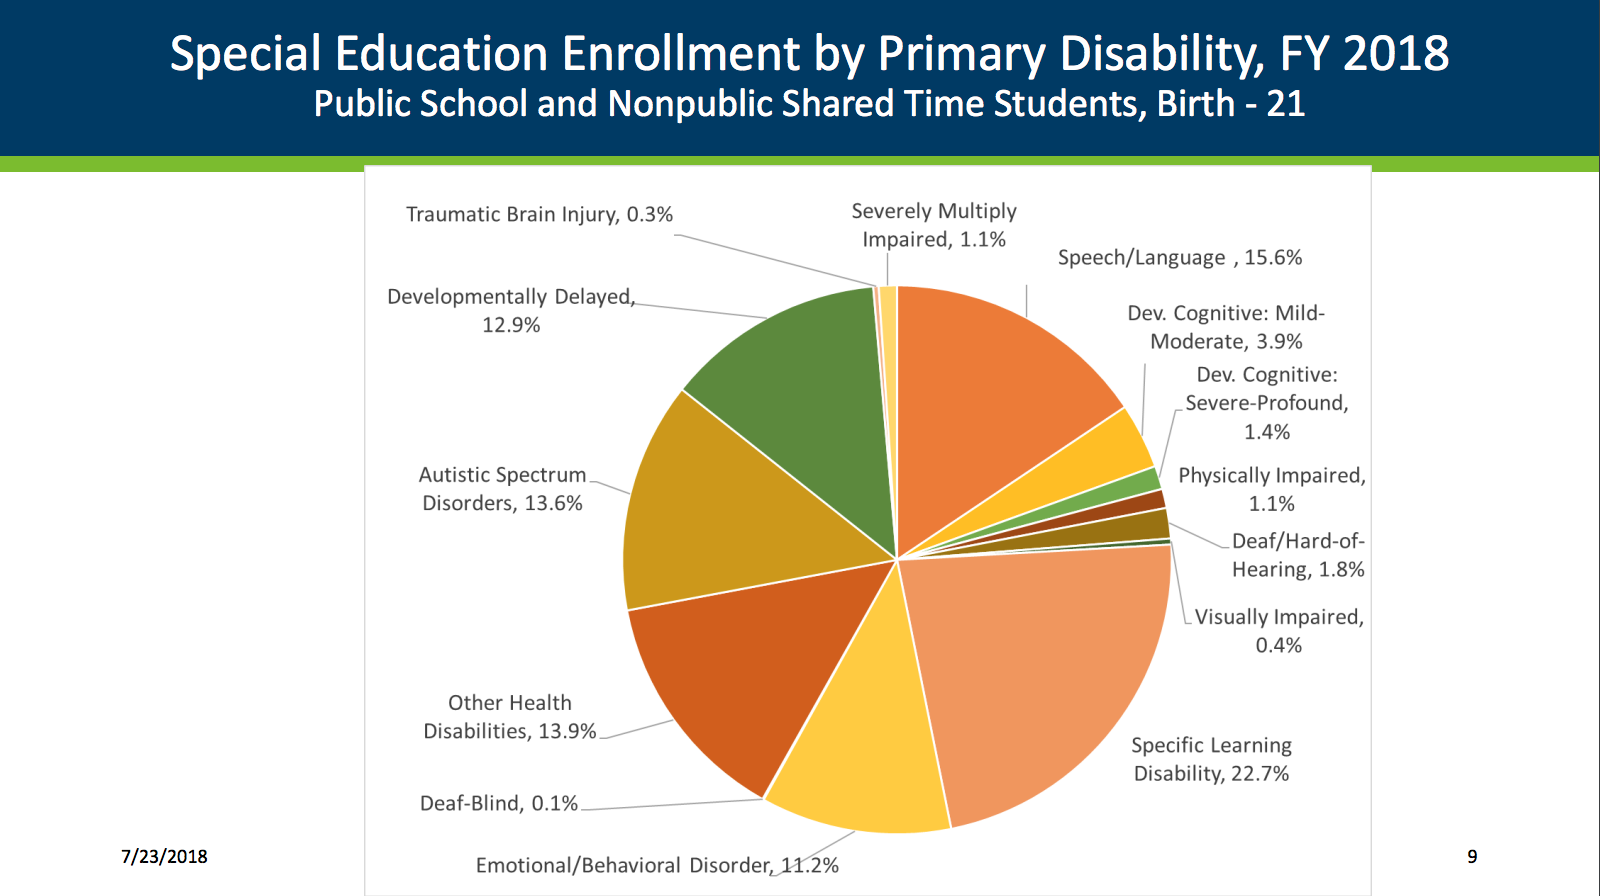
Data shows that students categorized with “Specific Learning Disabilities” account for the greatest percentage of students across Minnesota: nearly 23 percent — more than 32,000 students in 2017.
Among specific diagnoses, students with Autism showed the greatest increase overall, seeing a 555 percent increase between 2000- 2011 — and a jump from 15,378 students reported in 2011 to 19,386 in 2017.
Data shows most special education enrollments peak at or around age 10, with needs for services often decreasing as children become older or more independent. The greatest growth in special education has come in the age group of 6-year-olds, with an enrollment increase of nearly 1,500 between 2012-2018.
The number of students of color enrolled in special education increased by 75 percent between 1999-2011 — which is noteworthy given that the number of students of color in general education increased in that same timeframe by only 44 percent. (The Program Finance Division presentation did not include updated numbers for 2012-2018).
As for the shift of higher special education enrollments outside of home districts, the trend does not appear to be slowing.
Partly as the result of more students enrolling outside of their home districts, Minneapolis and Saint Paul specifically have also seen their overall special education enrollment decrease. Special education enrollment has decreased in these metro districts by approximately 1,000 students (from 18 percent to 16 percent of student population) between 2012-2018, but has increased in the inner and outer suburbs by approximately 5,000 students (from 13 percent to 14 percent).
Still, costs for Minneapolis-Saint Paul will likely continue upward, Melcher said. The volume of students in the metro will still require more specialists in both districts, which almost always come at a higher cost. Districts such as Minneapolis and Saint Paul are spending more than $17,000 per student on average.
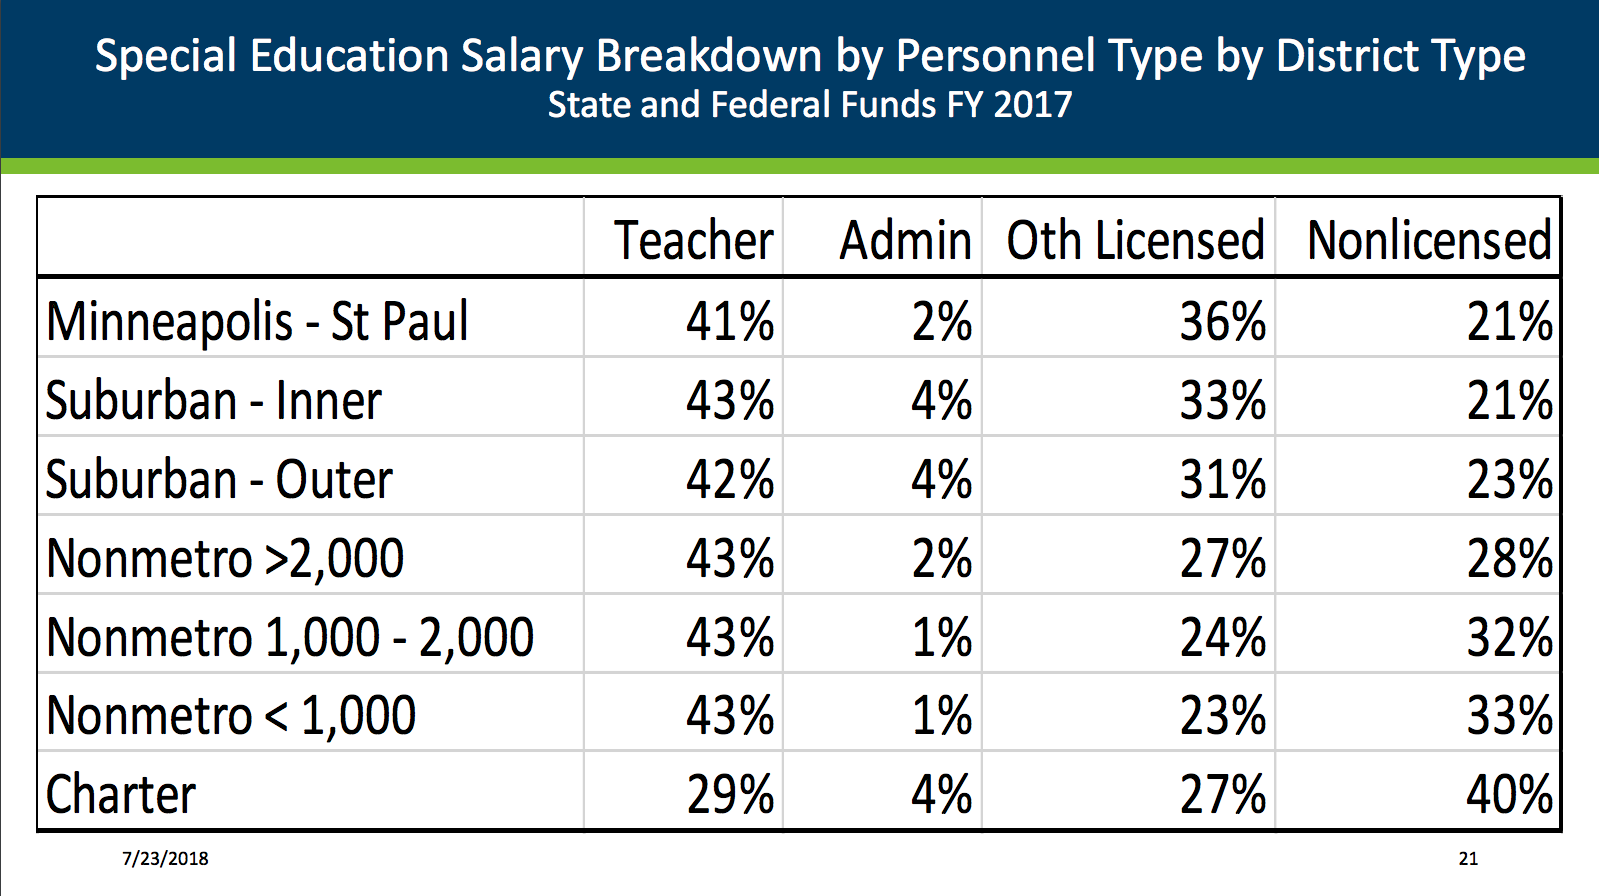
Staffing data also indicate students in Minneapolis and Saint Paul receive more specialized services than students in smaller districts, who often receive assistance from lower-cost nonlicensed personnel or paraprofessionals (an indication of more general care and less specialized services).
Moving forward, members of the Committee on E-12 Policy asked for additional details, namely whether Minnesota — which has many special education mandates that exceed federal requirements — could better align with federal requirements to contain costs.
The Committee meets again Aug. 21 at 9 a.m., with specific focus on the funding formula, the reimbursement impact on the cross subsidy, and a 50-state comparison of state funding for students with disabilities.